Skip to content

Conversation

@constantingoeldel
Copy link

@constantingoeldel constantingoeldel commented Jan 4, 2023

Hello, I've been working with AlphaBeta on a large dataset for Prof. Johannes, which is split up into > 100 separate windows. Because it takes quite a while to run AlphaBeta for each window, I looked at your code to find some quick opportunities for speedups. I found this:

LSE_intercept<-function(param_int)
  {
     sum((pedigree[,4] - param_int[4] - divergence(pedigree, p0mm, p0um, p0uu, param_int[1:3])[[2]])^2) +
      eqp.weight*nrow(pedigree)*((divergence(pedigree, p0mm, p0um, p0uu, param_int[1:3])[[1]]- eqp)^2)
  }

Which can be improved to this:

LSE_intercept<-function(param_int)
  {
     d = divergence(pedigree, p0mm, p0um, p0uu, param_int[1:3])
     sum((pedigree[,4] - param_int[4] - d[[2]])^2) +
      eqp.weight*nrow(pedigree)*((d[[1]]- eqp)^2)
  }

Because this function is a key part of the optimization loop, it is time critical -> The second version leads to a 2x speed up.
grafik
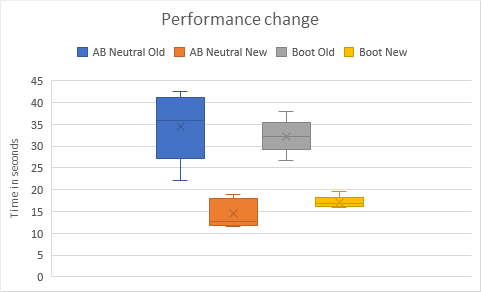
The change is applicable to AB Neutral & the BOOT model (so 4x in total) but also for all the other models.

I calculated the speedup with the AlphaBeta file under Vignettes and the library microbenchmark (Code below)

Do you know of any other simple speedups? I'm happy to implement them :)

BTW, thanks for the library, it's really useful!


Benchmark code
## ----setup, include = FALSE-------------------------------------------------------------------------------------------
options(width=120)
knitr::opts_chunk$set(
  collapse = FALSE,
  eval = TRUE,
  comment = " ",
  tidy.opts =list(width.cutoff=80),
  tidy = TRUE,
  size="small"
)

devtools::install_github("olafmersmann/microbenchmarkCore")
devtools::install_github("olafmersmann/microbenchmark")

## ---- include=FALSE---------------------------------------------------------------------------------------------------
library(AlphaBeta)
library(data.table)
library(igraph)
library(ggplot2)
library(microbenchmark)

## ----fig.align="center", echo=FALSE, out.width = "80%", fig.cap="Experimental systems"--------------------------------
#knitr::include_graphics(paste0(output.dir=getwd(),"/Figure1.png"))
f1 <- system.file("extdata/vg", "Figure1.png",  package = "AlphaBeta")
knitr::include_graphics(f1)

## ----fig.align="center", echo=FALSE, out.width = "80%", fig.cap="Pedigrees and DNA methylation sampling strategies.\nS* denotes sampled individuals and S are their (typically unsampled) most recent ancestors."----
f2 <- system.file("extdata/vg", "Figure2.pdf",  package = "AlphaBeta")
knitr::include_graphics(f2)

## ---------------------------------------------------------------------------------------------------------------------
#Load "nodelist.fn" file
sampleFile <- system.file("extdata/vg", "nodelist.fn",  package = "AlphaBeta")

## ----echo=FALSE-------------------------------------------------------------------------------------------------------
file <- fread(sampleFile)
head(file,10)

## ---------------------------------------------------------------------------------------------------------------------
#Load "edgelist.fn" file
edgesFile <- system.file("extdata/vg", "edgelist.fn",  package = "AlphaBeta")

## ----echo=FALSE-------------------------------------------------------------------------------------------------------
edges <- fread(edgesFile)
head (edges, 10)

## ---------------------------------------------------------------------------------------------------------------------
#Load "SOMA_nodelist.fn" file
treeSamples <- system.file("extdata/soma", "SOMA_nodelist2.fn", package="AlphaBeta")

## ----echo=FALSE-------------------------------------------------------------------------------------------------------
fileTree <- fread(treeSamples)
head(fileTree, 10)

## ---------------------------------------------------------------------------------------------------------------------
treeEdges <- system.file("extdata/soma", "SOMA_edgelist2.fn", package="AlphaBeta")

## ----echo=FALSE-------------------------------------------------------------------------------------------------------
fileEdges <- fread(treeEdges)
head(fileEdges, 10)

## ----echo=FALSE-------------------------------------------------------------------------------------------------------
f3 <- system.file("extdata/vg", "methylome-sample.png",  package = "AlphaBeta")
knitr::include_graphics(f3)

## ----echo=FALSE, out.width = "60%"------------------------------------------------------------------------------------
f4 <- system.file("extdata/vg", "methylome-sample-region.png",  package = "AlphaBeta")
knitr::include_graphics(f4)

## ----eval=FALSE, include=TRUE-----------------------------------------------------------------------------------------
#  output <- buildPedigree(nodelist = sampleFile,
#                          edgelist = edgesFile,
#                          cytosine = "CG",
#                          posteriorMaxFilter = 0.99)

## ----include=FALSE----------------------------------------------------------------------------------------------------
rFile <- system.file("extdata/dm","output.rds", package="AlphaBeta")
output <- readRDS(rFile )

## ---------------------------------------------------------------------------------------------------------------------
head(output$Pdata)     

## ----eval=FALSE, include=TRUE-----------------------------------------------------------------------------------------
#  outputTree <- buildPedigree(nodelist = treeSamples,
#                          edgelist = treeEdges,
#                          cytosine = "CG",
#                          posteriorMaxFilter = 0.99)

## ----include=FALSE----------------------------------------------------------------------------------------------------
TrFile <- system.file("extdata/soma","outputSoma.rds", package="AlphaBeta")
outputTree <- readRDS(TrFile)

## ---------------------------------------------------------------------------------------------------------------------
head(outputTree$Pdata)     

## ----eval=FALSE, include=TRUE-----------------------------------------------------------------------------------------
#  
#  ## Progenitor-endpoint design
#  plotPedigree(nodelist=sampleFile,
#                 edgelist=edgesFile,
#                 sampling.design="progenitor.endpoint",
#                 output.dir=out.dir,
#                 plot.width=5,
#                 plot.height=5,
#                 aspect.ratio=1,
#                 vertex.size=6,
#                 vertex.label=FALSE,
#                 out.pdf="MA1_1")
#  
#  ## Sibling design
#  plotPedigree(nodelist=system.file("extdata/vg","nodelist_MA2_3.fn", package="AlphaBeta"),
#                 edgelist=system.file("extdata/vg","edgelist_MA2_3.fn", package="AlphaBeta"),
#                 sampling.design="sibling",
#                 output.dir=out.dir,
#                 plot.width=5,
#                 plot.height=5,
#                 aspect.ratio=2.5,
#                 vertex.size=12,
#                 vertex.label=FALSE,
#                 out.pdf="MA2_3")
#  
#  ## Progenitor-intermediate design
#  plotPedigree(nodelist=system.file("extdata/vg","nodelist_MA3.fn", package="AlphaBeta"),
#                 edgelist=system.file("extdata/vg","edgelist_MA3.fn", package="AlphaBeta"),
#                 sampling.design="progenitor.intermediate",
#                 output.dir=out.dir,
#                 plot.width=5,
#                 plot.height=8,
#                 aspect.ratio=2.5,
#                 vertex.size=13,
#                 vertex.label=FALSE,
#                 out.pdf="MA3")

## ----fig.align="center", echo=FALSE, out.width = "90%", fig.cap="Pedigrees of MA lines with progenitor.endpoint (left), sibling (middle) and progenitor.intermediate design (right)"----
f5 <- system.file("extdata/vg", "MAlines.png",  package = "AlphaBeta")
knitr::include_graphics(f5)

## ----eval=FALSE, include=TRUE-----------------------------------------------------------------------------------------
#  plotPedigree(nodelist=treeSamples,
#                 edgelist=treeEdges,
#                 sampling.design="tree",
#                 output.dir=out.dir,
#                 plot.width=5,
#                 plot.height=5,
#                 aspect.ratio=1,
#                 vertex.size=8,
#                 vertex.label=FALSE,
#                 out.pdf="Tree")
#  

## ----fig.align="left", echo=FALSE, out.width = "70%", fig.cap="Pedigree of a tree with 2 stems (left) and a single stem (right)"----
f6 <- system.file("extdata/vg", "Trees.png",  package = "AlphaBeta")
knitr::include_graphics(f6)

## ----echo=TRUE--------------------------------------------------------------------------------------------------------
pedigree<- output$Pdata
dt <- pedigree[,2] + pedigree[,3] - 2 * pedigree[,1]
plot(dt, pedigree[,"D.value"], ylab="Divergence value", xlab=expression(paste(Delta, " t")))

## ---------------------------------------------------------------------------------------------------------------------
p0uu_in <- output$tmpp0
p0uu_in
pedigree <- output$Pdata

# # ## ----output.lines=5---------------------------------------------------------------------------------------------------
# # # output directory
# # output.data.dir <- paste0(getwd()) 
# # start_time <- Sys.time()
# # output <- ABneutral(
# #   pedigree.data = pedigree,
# #   p0uu = p0uu_in,
# #   eqp = p0uu_in,
# #   eqp.weight = 1,
# #   Nstarts = 2,
# #   out.dir = output.data.dir,
# #   out.name = "ABneutral_CG_global_estimates"
# # )
# # end_time <- Sys.time()
# # build_time <- end_time - start_time
# ## ----output.lines=5---------------------------------------------------------------------------------------------------
# summary(output)

# ## ----output.lines=5---------------------------------------------------------------------------------------------------
# head(output$pedigree)

## ----eval=FALSE, include=TRUE-----------------------------------------------------------------------------------------
#  ABfile <- system.file("extdata/models/",
#                        "ABneutral_CG_global_estimates.Rdata",
#                        package = "AlphaBeta")
#  #In 'ABplot' function you can set parameters to customize the pdf output.
#  ABplot(pedigree.names=ABfile, output.dir=getwd(), out.name="ABneutral", plot.height=8, plot.width=11)

## ----fig.align="center", echo=FALSE, out.width = "80%", fig.cap = "Divergence versus delta.t"-------------------------
f7 <- system.file("extdata/vg", "ABneutral_MA1_1.pdf",  package = "AlphaBeta")
knitr::include_graphics(f7)

# ## ---------------------------------------------------------------------------------------------------------------------
# outputABselectMM <- ABselectMM(
#   pedigree.data = pedigree,
#   p0uu = p0uu_in,
#   eqp = p0uu_in,
#   eqp.weight = 1,
#   Nstarts = 2,
#   out.dir = output.data.dir,
#   out.name = "ABselectMM_CG_global_estimates"
# )


# ## ---------------------------------------------------------------------------------------------------------------------
# outputABselectUU <- ABselectUU(
#   pedigree.data = pedigree,
#   p0uu = p0uu_in,
#   eqp = p0uu_in,
#   eqp.weight = 1,
#   Nstarts = 2,
#   out.dir = output.data.dir,
#   out.name = "ABselectUU_CG_global_estimates"
# )


# ## ---------------------------------------------------------------------------------------------------------------------
# outputABnull <- ABnull(
#   pedigree.data = pedigree,
#   out.dir = output.data.dir,
#   out.name = "ABnull_CG_global_estimates"
#   )


# ## ---------------------------------------------------------------------------------------------------------------------
# file1 <-
#   system.file("extdata/models/",
#               "ABneutral_CG_global_estimates.Rdata",
#               package = "AlphaBeta")
# file2 <-
#   system.file("extdata/models/",
#               "ABnull_CG_global_estimates.Rdata",
#               package = "AlphaBeta")

# out <- FtestRSS(pedigree.select = file1,
#                 pedigree.null = file2)

# out$Ftest

# ## ---------------------------------------------------------------------------------------------------------------------
# file1 <-
#   system.file("extdata/models/",
#               "ABselectMM_CG_global_estimates.Rdata",
#               package = "AlphaBeta")
# file2 <-
#   system.file("extdata/models/",
#               "ABnull_CG_global_estimates.Rdata",
#               package = "AlphaBeta")

# out <- FtestRSS(pedigree.select = file1,
#                 pedigree.null = file2)

# out$Ftest

# ## ---------------------------------------------------------------------------------------------------------------------
# file1 <-
#   system.file("extdata/models/",
#               "ABselectUU_CG_global_estimates.Rdata",
#               package = "AlphaBeta")
# file2 <-
#   system.file("extdata/models/",
#               "ABnull_CG_global_estimates.Rdata",
#               package = "AlphaBeta")

# out <- FtestRSS(pedigree.select = file1,
#                 pedigree.null = file2)

# out$Ftest

## ---------------------------------------------------------------------------------------------------------------------
inputModel <- system.file("extdata/models/",
              "ABneutral_CG_global_estimates.Rdata",
              package = "AlphaBeta")

# # Bootstrapping models CG
# start_time <- Sys.time()
# Boutput <- BOOTmodel(
#   pedigree.data = inputModel,
#   Nboot = 2,
#   out.dir = getwd(),
#   out.name = "ABneutral_Boot_CG_global_estimates"
# )
# end_time <- Sys.time()

# boot_time <- end_time - start_time

# summary(Boutput)

# ## ----echo=FALSE-------------------------------------------------------------------------------------------------------
# Boutput$standard.errors


benchmark2 = microbenchmark(ABneutral(
  pedigree.data = pedigree,
  p0uu = p0uu_in,
  eqp = p0uu_in,
  eqp.weight = 1,
  Nstarts = 2,
  out.dir = output.data.dir,
  out.name = "ABneutral_CG_global_estimates"
),   BOOTmodel(
  pedigree.data = inputModel,
  Nboot = 2,
  out.dir = getwd(),
  out.name = "ABneutral_Boot_CG_global_estimates"
), times = 5)

benchmark2
plot(benchmark2)

benchmark_combined = benchmark + benchmark2

plot(benchmark_combined)


# ## ---------------------------------------------------------------------------------------------------------------------
# Tree_p0uu_in <- outputTree$tmpp0
# Tree_p0uu_in

# ## ---------------------------------------------------------------------------------------------------------------------
# pedigree.Tree <- outputTree$Pdata

# ## ---------------------------------------------------------------------------------------------------------------------
# outputABneutralSOMA <- ABneutralSOMA(
#   pedigree.data = pedigree.Tree,
#   p0uu = Tree_p0uu_in,
#   eqp = Tree_p0uu_in,
#   eqp.weight = 0.001,
#   Nstarts = 2,
#   out.dir = getwd(),
#   out.name = "ABneutralSOMA_CG_global_estimates"
# )


# ## ----eval=TRUE, include=FALSE-----------------------------------------------------------------------------------------
# ABfilesoma <- system.file("extdata/models/", 
#                       "ABneutralSOMA_CG_global_estimates.Rdata", 
#                       package = "AlphaBeta")
# outputABneutralSOMA <- dget(ABfilesoma)

# ## ----eval=TRUE, include=TRUE------------------------------------------------------------------------------------------
# summary(outputABneutralSOMA)
# head(outputABneutralSOMA$pedigree)

# ## ----eval=FALSE, include=TRUE-----------------------------------------------------------------------------------------
# #  ABfilesoma <- system.file("extdata/models/",
# #                        "ABneutralSOMA_CG_global_estimates.Rdata",
# #                        package = "AlphaBeta")
# #  ABplot(pedigree.names=ABfilesoma, output.dir=getwd(), out.name="ABneutralSOMA", plot.height=8, plot.width=11)

# ## ----fig.align="center", echo=FALSE, out.width = "80%", fig.cap = "Divergence versus delta.t of Tree"-----------------
# f8 <- system.file("extdata/vg", "ABneutralSOMA.pdf",  package = "AlphaBeta")
# knitr::include_graphics(f8)

# ## ---------------------------------------------------------------------------------------------------------------------
# outputABselectMMSOMA <- ABselectMMSOMA(
#   pedigree.data = pedigree.Tree,
#   p0uu = Tree_p0uu_in,
#   eqp = Tree_p0uu_in,
#   eqp.weight = 0.001,
#   Nstarts = 2,
#   out.dir = getwd(),
#   out.name = "ABselectMMSOMA_CG_global_estimates"
# )


# ## ---------------------------------------------------------------------------------------------------------------------
# outputABselectUUSOMA <- ABselectUUSOMA(
#   pedigree.data = pedigree.Tree,
#   p0uu = Tree_p0uu_in,
#   eqp = Tree_p0uu_in,
#   eqp.weight = 0.001,
#   Nstarts = 2,
#   out.dir = getwd(),
#   out.name = "ABselectUUSOMA_CG_global_estimates"
# )


# ## ---------------------------------------------------------------------------------------------------------------------
# inputModelSOMA <- system.file("extdata/models",
#               "ABneutralSOMA_CG_global_estimates.Rdata",
#               package = "AlphaBeta")

# # Bootstrapping models CG

# Boutput <- BOOTmodel(
#   pedigree.data = inputModelSOMA,
#   Nboot = 2,
#   out.dir = getwd(),
#   out.name = "ABneutral_Boot_CG_global_estimates"
# )

# summary(Boutput)

# ## ----echo=FALSE-------------------------------------------------------------------------------------------------------
# Boutput$standard.errors

# ## ---------------------------------------------------------------------------------------------------------------------
# sessionInfo()

Sign up for free to join this conversation on GitHub. Already have an account? Sign in to comment

Labels

None yet

Projects

None yet

Development

Successfully merging this pull request may close these issues.

1 participant